Average True Range (ATR) Trailing Stop
The Basics
Average True Range (ATR) is usually used to set trailing stops to close positions based on average true range. Not commonly used to open positions.
Indicator Type
Trade trigger
Markets
All cash and futures, not options.
Works Best
All market types in daily and weekly time frames, although it can be used intraday, as well. However, trending markets are best.
Formula
Calculate the Average True Range and then multiply by the multiplier. For an uptrend, subtract from previous close. For a down trend, add to previous close.
Parameters

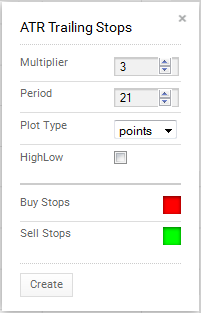
ATR typically uses between a 5- and 21-period span. Originator Welles Wilder suggested using 7. Multiples vary between 2.5 and 3.5 ATR and Wilder suggested 3. It defaults to a 21-period average of the True Range and 3-period multiple for the stop.
You can also select the colour for Average True Range line by selecting the box to bring up a colour palette.
The format for the stop can be set by setting the plot type to points or square wave.
The High/Low option bases the stop on the previous period’s high for up trends and previous period’s low for down trends.
Theory
All stops attempt to limit risk by placing orders to exit a trade if price moves in the wrong way. Some traders simply use a percentage; others use technical levels such as support, resistance and trendlines. Still others use complicated formulas using indicators and price action together (if indicator crosses X then exit).
ATR Trailing Stops are based on average true range, which itself attempts to consider period to period changes as well as the range for the current period. By doing so, it incorporates volatility into the mix so that stops for more volatile stocks are wider and stops for more sedate stocks are narrower.
Interpretation
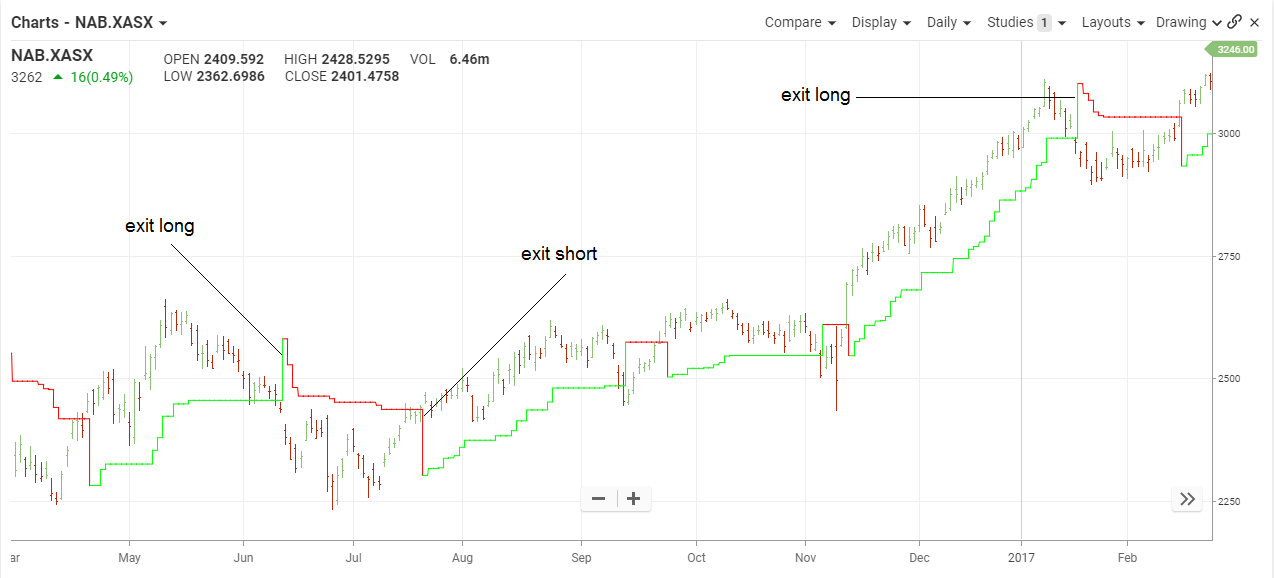
The Average True Range Trailing Stop is similar to other trailing stop methods. If price action remains above the stop in up trends and below it for down trends, the position is held. As soon as price crosses the stop, the position is exited.

NAB shows a nice declining trend on the left side of the chart and a stop out when price jumped up at the end of July 2016. The ensuing decline was short-lived and the stop for short sellers was triggered quickly for only a minimal gain.
The next up-phase began but stalled in mid July. The trade was kept because the stop was not triggered, thanks to the average true range staying wide. As we can see, capital was tied up during the flat phase even though there were no actual losses.
This demonstrates that trending markets are better for this method.
Math
TR=True Range = defined as the greatest of the following:
- Current high minus the current low
- Current high minus the previous close (absolute value)
- Current low minus the previous close (absolute value)
ATR = simple moving average of TR
ATR Trailing Stop in a rising trend is highest price over the user-defined span minus (multiplier * ATR). If prices continue to rise, the stop will continue to rise. However, if prices flatten out or pull back the stop will be flat. Only when price dips below the flat stop line will it flip to the inverse with the stop above prices.
