Money Flow Index
The Basics
Used to identify overbought and oversold conditions
Indicator Type
Momentum Oscillator
Markets
All cash and futures, not options
Works Best
All market types and time frames although daily is the most popular. Beware that many volume based indicators are less effective in recent years than they were before.
Formula
The formula is essentially a volume-weighted relative strength index (RSI). However, instead of using simple close prices, MFI uses the typical price multiplied by volume. The result is then used in the RSI calculation as a ratio of average volume weighted size of the up-closes over the past “n” periods and compared to the average volume weighted size of the down-closes. The result is indexed between 0 and 100.
Parameters

Parameters are based on personal preference, but most users start with 14 periods. For quicker analysis, use a smaller period and for slower analysis, use a larger period.
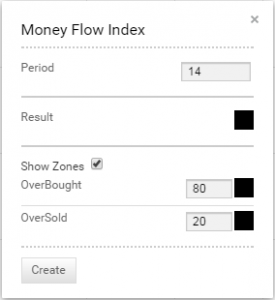
Technician defaults to a period of 14.
The “Show Zones” box tells the software to fill in the area between the MFI plot and the horizontal overbought and oversold levels. These levels default to 80 for overbought and 20 for oversold although some users prefer 90 and 10, respectively.
You can also select colour for the MFI plot and two zone lines by selecting the boxes next to each to bring up a colour palette.
Theory
Prices are generally considered to be elastic in that they can move only so far from a mean price before reacting or retracing. The slope and values of the MFI are proportional to the velocity of the price move. Volume weighting gives more importance in the calculation to periods that were more actively traded and can be helpful in identifying overbought and oversold situations.
Interpretation
The MFI value itself ranges from 0 to 100 and support, resistance and trends can be found on the MFI plot. A MFI value above 80 indicates a possible overbought situation and a value below 20 indicates a possible oversold condition. However, some users prefer the 90 and 10 levels for less frequent but more important overbought and oversold conditions.
This does not mean, however, that a market will immediately reverse once either of these levels is reached. It is more likely that the market will pause to consolidate, resulting in a more neutral MFI value.
Relatively high MFI levels (60-80) normally accompany a rising trend and relatively low MFI levels (20-40) normally accompany a declining price trend. If price makes a higher high and MFI makes a lower high, the divergence between the two could signal bearish a market reversal. Conversely, a lower low in price and higher low in RSI could signal a bullish market reversal.
Theoretically, MFI gives additional lead time to market signals because of the volume element.

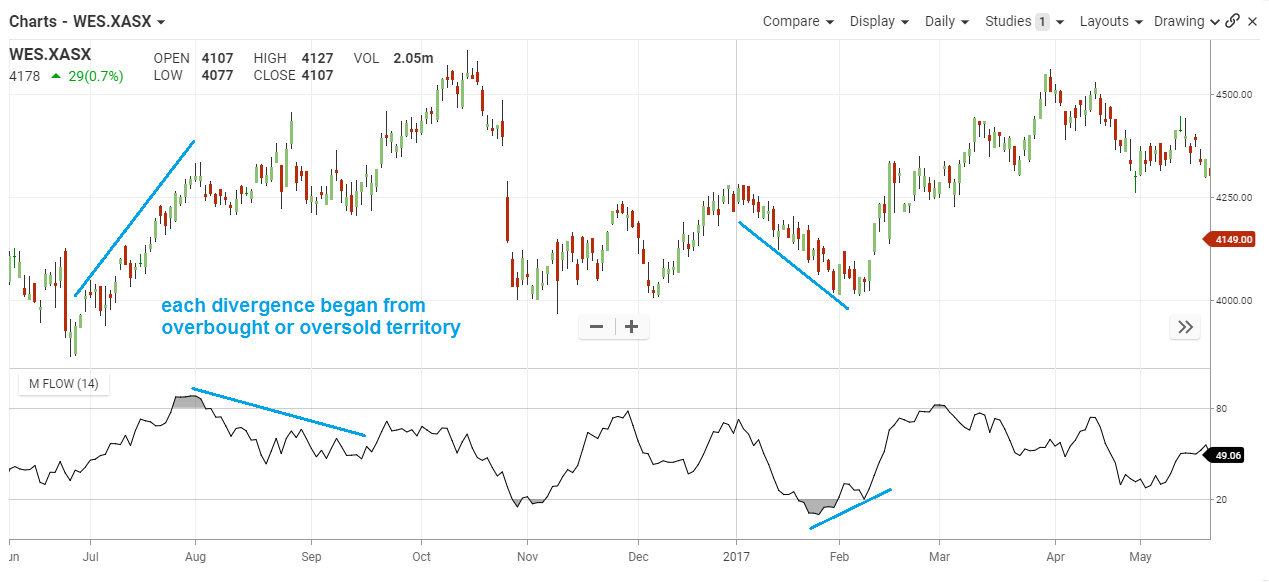
In this chart, we can see several divergences between price and the money flow index in a short period of time.
In July 2016, West Farmers we saw a sharp rise on, then the price dropped when it reached the overbought levels on the money flow index.
The opposite occurred in January 2017 with MFI reaching oversold then setting a lower trend. Again, the result was a multi-week move, only this time to the upside on a bullish divergence.
Math
Calculate Money Flow = Typical Price x Volume
Typical Price = (High + Low + Close)/3
Find positive money flow = sum of the volume weighted “up” typical price changes for the past n-periods
Find negative money flow = sum of the volume weighted “down” typical price changes for the past n-periods
Calculate Money Flow ratio = (n-period positive Money Flow)/ (n-period negative Money Flow)
Calculate Money Flow Index = 100 – 100/ (1 + Money Flow Ratio)
