Price Rate of Change
The Basics
Price rate of change is used to identify overbought/oversold conditions.
Indicator Type
Momentum indicator
Markets
All cash and futures, not options
Works Best
All markets and time frames
Formula
( (Current Price – Price n-periods ago) / Price n-periods ago) * 100
Parameters

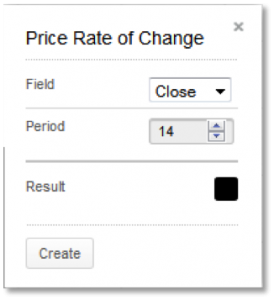
Commonly used parameters are 10 and 21 days and 52 weeks. Choose the “n” value to coincide with market cycles.
Theory
The rate of a trend increases as that trend develops until it reaches a market specific level. Extreme rates of increase could mean that the market is overheated and in need of a pause. If a market is still making new highs or low while the rate of market trend has declined, market participants are less willing to commit further to the trend.
Interpretation
There are four basic events to follow on a momentum chart. The first is a crossing of the zero line. If momentum is negative and crosses the zero line to positive territory, it could be a buy signal. Note that this is only a valid signal when the line is crossed in the direction of the prevailing trend.
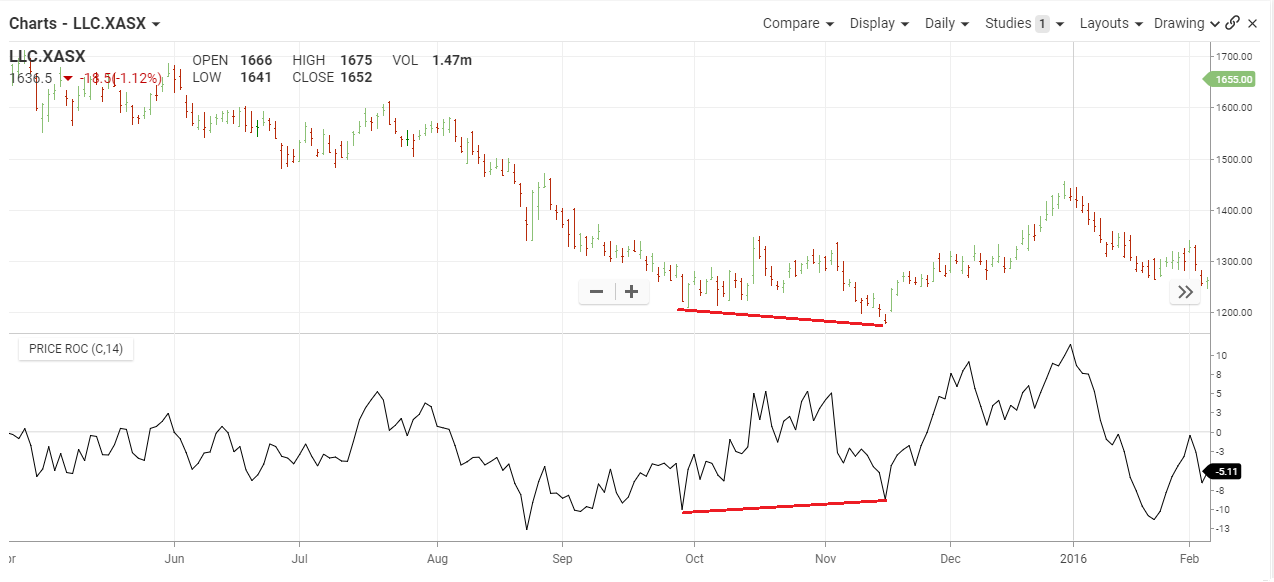
The second event is a divergence with price action. If prices make lower lows but momentum makes higher lows, down side market momentum is declining.
The third event is a very high or very low level of momentum, which may indicate an overbought or oversold condition. Since momentum is not indexed (constrained to move between 0 and 100) we must make a comparison to historical levels in that specific market to determine if it is overbought or oversold.
Trend line analysis can also be used on momentum (event number four). Trend breaks in indicators often precede trend changes in price.

Lend Lease traded down in September 2016 and rate of change stayed in a narrow band under zero. After trending to a lower price low in October 2016. However, rate of change set a higher low and this divergence between price and indicator suggested a change was coming.
Math
ROC = Current Price – Price (n-periods ago) * 100 -1
Price n-periods ago
