Accumulation Distribution
The Basics
Accumulation/distribution is a momentum indicator that attempts to gauge supply and demand by determining whether investors are generally “accumulating,” or buying, or “distributing,” or selling, a certain stock by identifying divergences between stock price and volume flow. The accumulation/distribution is calculated by first calculating the money flow multiplier, and then multiplying the money flow multiplier by the period’s volume.
Indicator Type
Trend finder
Markets
All cash and futures, not options
Works Best
All markets and time frames although this study can excel in determining if a visually flat market is starting to develop a trend.
Formula

Parameters
There are three steps to calculating the Accumulation Distribution Line (ADL). First, calculate the Money Flow Multiplier. Second, multiply this value by volume to find the Money Flow Volume. Third, create a running total of Money Flow Volume to form the Accumulation Distribution Line (ADL).
Theory
Find the money flow multiplier by identifying the difference between the closing price and the low price of the range. Next, calculate the difference between the high price of the range and the closing price of the range. Then, subtract the difference between the high price of the range and the closing price from the difference between the closing price and the low price of the range. Lastly, divide the resulting value by the difference between the high price and the low price of the range.
After the money flow multiplier is calculated, the money flow volume, or the accumulation/distribution, is calculated by multiplying the money flow multiplier by the volume for the period. The accumulation/distribution line is then calculated by summing the previous period’s accumulation/distribution and the current period’s money flow volume.
Interpretation
The accumulation/distribution line may be used as an indicator to confirm whether a security is trending. If a security is in a strong downtrend or uptrend, the accumulation/distribution likely follows the direction of the price movements, and therefore, confirms the downtrend or uptrend. If the accumulation/distribution line and a security’s price are diverging, it may be a bullish or bearish signal.
If a security’s price is in a downtrend while the accumulation/distribution line is in an uptrend, the indicator shows there may be buying pressure and the security’s price may reverse. Consequently, the security may reverse and trend up. Conversely, if a security’s price is in an uptrend while the accumulation/distribution line is in a downtrend, the indicator shows there may be selling pressure, or high distribution. This may cause the security’s price to reverse and turn into a downtrend.


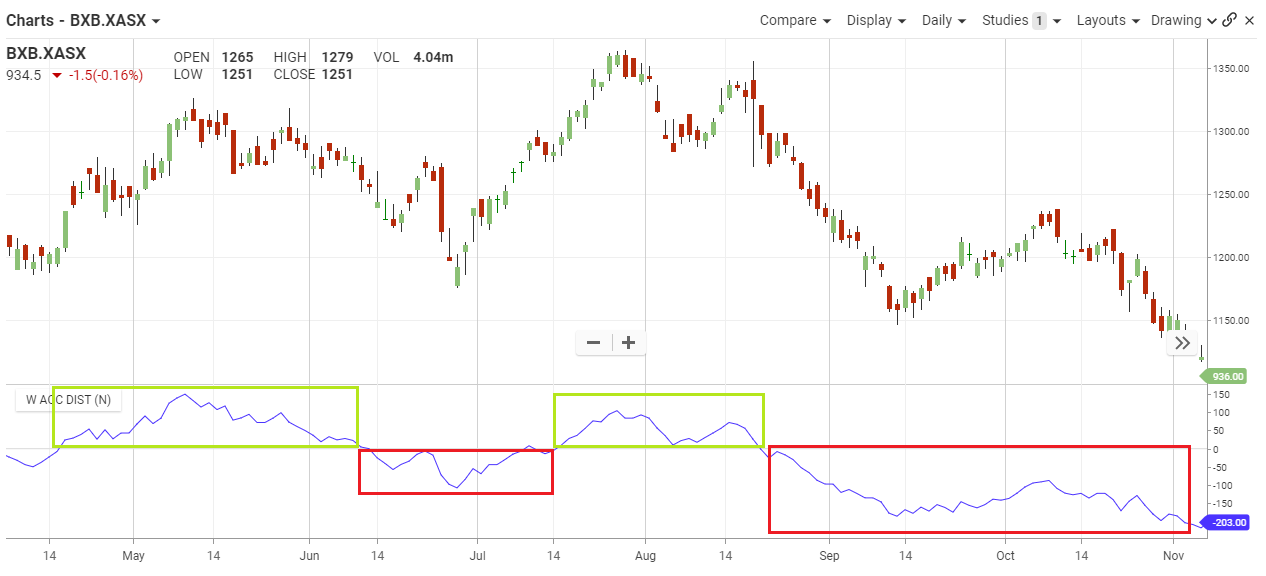
In the chart above, BXB had several periods in 2016 where its trended above and below the signal line. The May – June and August period you can see the distinct uptrend of buying pressure, reflecting in the price uptrend.
Contrary to that when the Accumulation Distribution went below the signal line in July and September on, the sell pressure saw the price drop accordingly.
Math
- Money Flow Multiplier = [(Close – Low) – (High – Close)] /(High – Low)
- Money Flow Volume = Money Flow Multiplier x Volume for the Period
- ADL = Previous ADL + Current Period’s Money Flow Volume
