Awesome Oscillator
The Basics
Used to identify overbought and oversold conditions.
Indicator Type
Momentum Oscillator
Markets
All cash and futures, not options
Works Best
All market types and time frames although intraday is the most popular.
Formula
The difference between two simple moving averages using the median price instead of the close price. The result does not have high or low limits.
Parameters

The most common parameters are 5 for the fast average and 34 for the slow average. Technician uses these values.
You can also select colour for the increasing and decreasing bars by selecting the boxes next to each to bring up a colour palette.
Theory
The awesome oscillator will fluctuate between positive and negative territory. A positive reading means the faster moving average is greater than the slower moving average. A negative reading means faster average is less than the slower average.
The colour of the bars depends on its value compared to the bar before. If the oscillator value is greater than the previous it is typically painted green. If it is lower than it is typically painted red, although the user can have changed these colours. It is possible to have green bars with negative values and red bars with positive values.
As with MACD, when the market is rising, the faster average will move quicker, and the oscillator values will rise. When the market slows down as it tops, the faster average will turn sooner and eventually cross down below the slower average.
Interpretation
Interpretation is like MACD including buying when the oscillator crosses through the zero line to the upside and selling when it crosses back below. Of course, this will result is many false signals in flat or choppy markets.
Another use would be the “saucer signal” which finds pullbacks in existing trends, like a small three-bar reversal. For the long side, when the oscillator is above zero, the setup is two consecutive red bars followed by a green bar. Buy the next period’s open.
Conversely, for a sell the oscillator should be below zero. After two green consecutive bars and a red bar, sell the next period’s open.
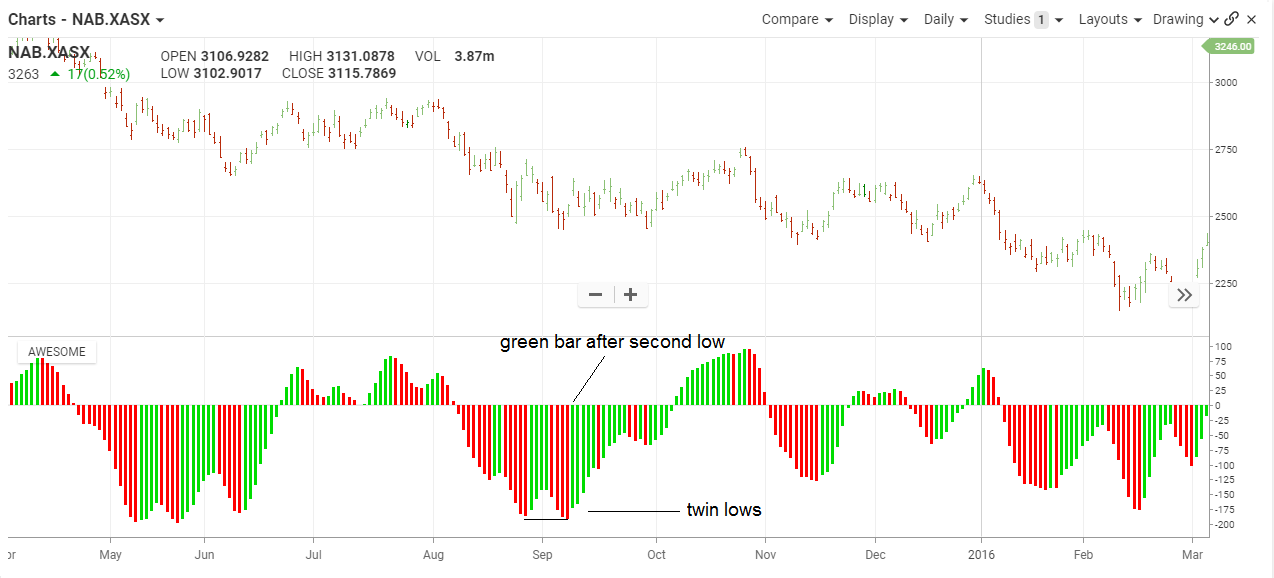
Divergence analysis works well here but not as it does in other indicators. If the oscillator makes two consecutive highs, even if the second is not lower than the first, it creates a bearish setup at the first red bar. And on the bullish side, two consecutive lows in the oscillator, even if the second is not higher than the first, creates the setup on the first green bar.

In this chart we see National Australia Bank falling into the August 2015, however in early September it made a lower low. The awesome oscillator displayed the twin lows in August and September and indicated the trend reversal of the green bar after the second low.
It formed a saucer signal with two red bars (four, in this case) and a green bar. The buy signal was at the open the next day.
Math
Fast Period = Simple Moving Average (Highest Price + Lowest Price)/2
Slow Period = Simple Moving Average (Highest Price + Lowest Price)/2
