Chaikin Money Flow
The Basics
Used to measure demand and supply for a single instrument
Indicator Type
Buying/Selling Pressure Gauge
Markets
All cash and futures, not options
Works Best
All market types and time frames although daily is the most popular. Weekly may be more effective.
Formula
Like on-balance or cumulative volume, CMF uses price times volume. However, there are two main differences. Whereas on-balance volume calculates each period’s value and plots the running total, CMF acts more like a moving window. It sums up price times volume for a user defined span of periods and then calculates a fresh value for the next period.
The second difference is that instead of close price, CMF calculates the percentage of where the close price falls within that period’s range. Called a “multiplier” instead of simply price, it ranges from -1 for a close at the low to +1 for a close at the high.
Parameters

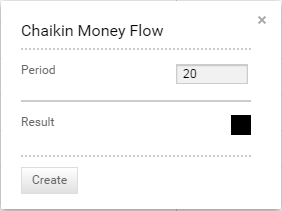
Parameters are based on personal preference, but most users start with 20 or 21 periods.
Technician defaults to a period of 20.
You can also select colour for the CMF plot by selecting the boxes next to each to bring up a colour palette.
Theory
Chaikin Money Flow (CMF) is a technical analysis indicator used to measure Money Flow Volume over a window of time. It attempts to measure buying and selling pressures of a security for single period. CMF then sums Money Flow Volume over a user-defined number of periods and divides by the total volume for that number of periods. The result varies between 1 and -1.
Creator Marc Chaikin believed that if a given period closes in the upper half of the range, then buying pressure is higher. Conversely, if the period closes in the lower half of the range, then selling pressure is higher.
If a stock, for example, closed at its high for 20 straight days, each day’s volume would be multiplied by 1, meaning all volume went to the bulls. The resulting CMF would also be 1 and we can argue that this rare occurrence would leave the stock quite overbought.
For a stock moving sideways, the likely value of CMF would hover near 0 and suggest neither bulls nor bears were in control. However, this oscillator usually moves between -0.50 and +0.50.
Interpretation
The simplest way to use CMF is to identify buying pressure when the indicator is above zero and selling pressure when it is below zero. The higher it gets the stronger the buying pressure. And the lower it gets (more negative) the stronger the selling pressure.
When CMF crosses the zero Line it can alert the user that a trend reversal is possible.
To reduce false signals, many users expand the threshold for these signals buy requiring the indicator to cross above 0.05 for a buy and below -0.05 for a sell. However, it is best to look back at the securities history to fine tune these levels.
Unlike traditional money flow indicators, divergences between Chaikin Money Flow and price are not as effective. For example, even if the indicator set a lower peak in positive territory it is still in positive territory. Price momentum may slow down but price direction does not necessarily follow. Users can take a lower high as a warning, but each peak should be taken on its own.
Chaikin Money Flow does have a problem handling gaps. For example, if a stock gaps up but closes in the bottom of its range the Money Flow Volume value for that period would be negative and the CMF calculation would fall. This despite the rather bullish price jump.
There is also a problem with volatile securities. Even if there are valid up and down trends in place, CMF can provide many whipsaws if price action within the trend is choppy. Therefore, it pays to look at the security’s history to see if this has been the case. If it has, then it may not be a good candidate for CMF analysis.

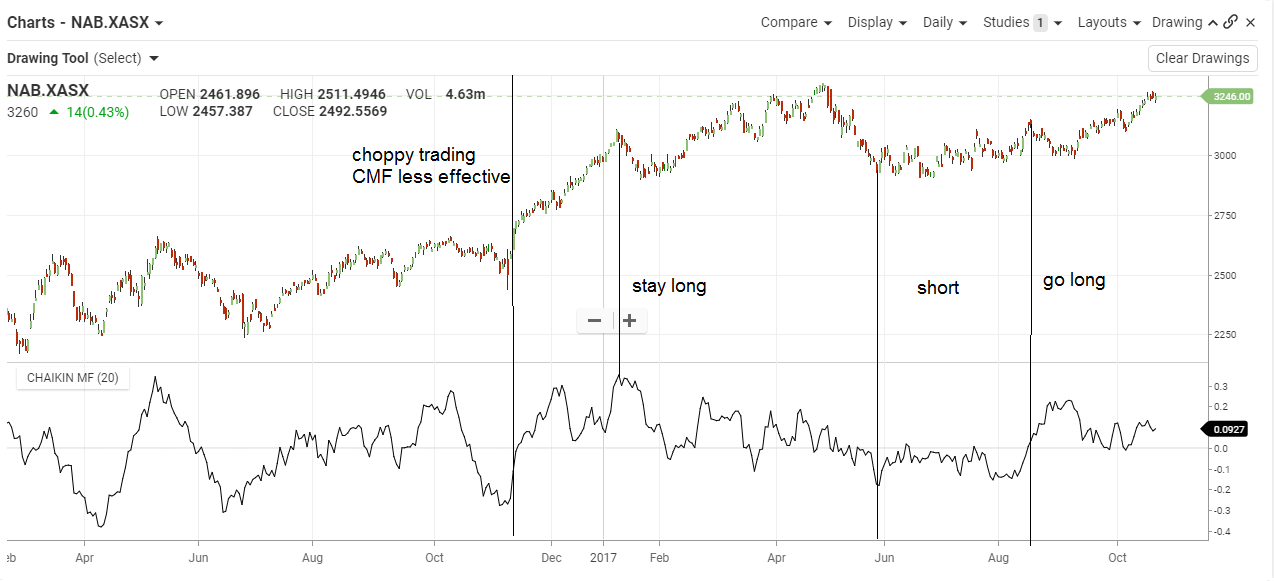
NAB moved sideways in a choppy range between mid 2016 and mid 2017. Chaikin Money Flow jumped from positive to negative often and could not hold either above or below the 0 line for long. It gave many false signals.
However, in late 2016, it gave a buy signal with a strong move above 0 although we did not know whether conditions had changed to make the indicator effective at that time. Perhaps trend strength indicators would have signalled that change. But a few weeks later, we saw the indicator hold above the 0 line before moving up again. This was our signal that the indicator was now effective.
Note that a range of -0.05 to +0.05 was added to avoid small false signals. It did save a whipsaw in January 2017 and kept the trader long until a true sell signal appeared in June. In this case, when the next buy signal appeared in August the short trade had become marginal at best.
Math
Find the Money Flow Multiplier = ((Close – Low) – (High – Close)) / (High – Low)
Calculate Money Flow Volume = (Money Flow Multiplier) x Volume
Calculate the CMF = (N-Period Sum of Money Flow Volume) / (N-Period Sum of Volume)
