Chande
The Basics
A technical momentum indicator invented by the technical analyst Tushar Chande. It is created by calculating the difference between the sum of all recent gains and the sum of all recent losses and then dividing the result by the sum of all price movement over the period. This oscillator is like other momentum indicators such as the Relative Strength Index and the Stochastic Oscillator because it is range bounded (+100 and -100).
Indicator Type
Momentum Oscillator
Markets
All cash and futures, not options
Works Best
All markets and time frames although this study can excel in determining if a visually flat market is starting to develop a trend.
Formula

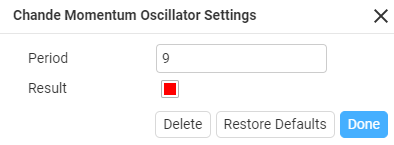
Parameters
The security is deemed to be overbought when the momentum oscillator is above +50 and oversold when it is below -50. Many technical traders add a nine-period moving average to this oscillator to act as a signal line. Bullish signals are generated when the oscillator crosses above the signal, and bearish signals are generated when the oscillator crosses down through the signal.
Theory
The Chande momentum oscillator has a base value of zero. Bullish signals are generated when the oscillator is positive, and bearish signals are generated when it is negative. Extremely overbought positions can be identified at high levels, such as +50, while extremely oversold positions might exist beyond -50. If this oscillator is complemented with another indicator (or even a moving average line based on the oscillator itself), you could reasonably use Chande’s formula to place short positions on very high values and long positions when the values are very low.
Some traders use the Chande momentum oscillator to confirm possible trends, entering when the oscillator is reading high and exiting when it moves below a certain threshold. If a security’s price action or another indicator seems to show a trend, but the Chande momentum oscillator shows sideways or choppy values (between -25 and 25), it could be a sign that the trend lacks momentum.
Interpretation
Trading with the chande momentum oscillator as a standalone indicator can prove a challenging task. Since the indicator will oscillate between +100 and -100, a break of +50 could mean that it is overbought, but remember the indicator has another 50 points it can run. What many traders do is to apply a moving average to the indicator and will use crosses of the CMO and a simple moving average to generate trade triggers. Another approach is to trade a security when the chande momentum oscillator has reached extreme readings. Extreme readings are an indication that a strong trend is in place, and traders will add to their positions on any minor corrections.

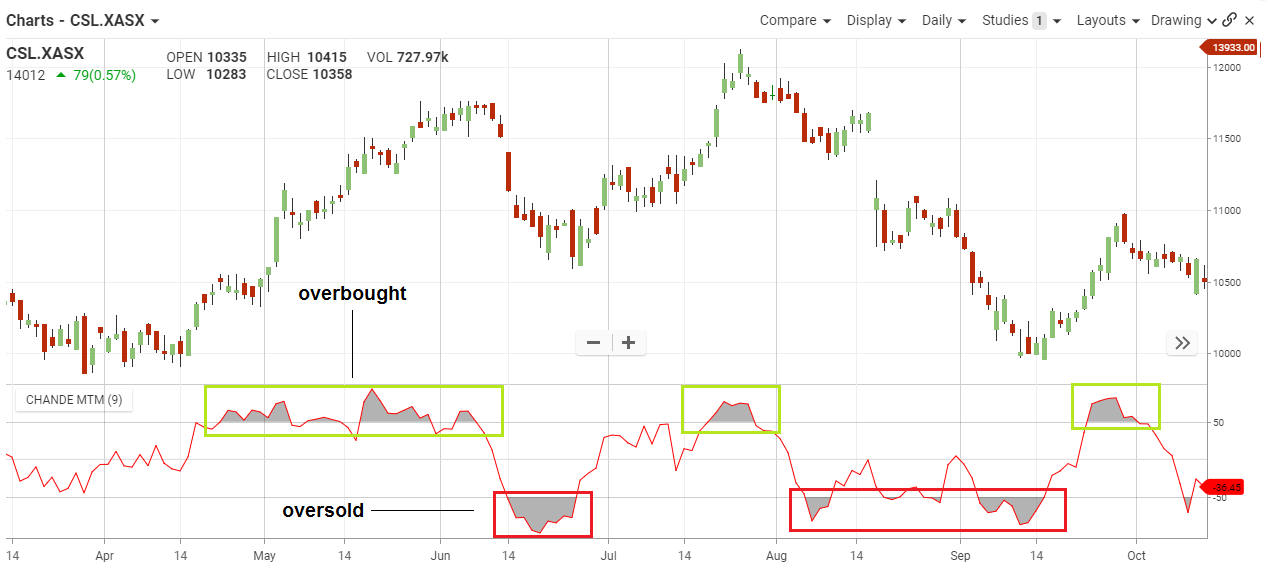
The CSL chart had several periods in 2016 where it trended between overbought and oversold. From mid-April to early-June it held an overbought trend where it held above the 50 signal line.
Shortly after the stock lost momentum it feels below the signal line into oversold, this also repeated in late August and through September.
CSL is good because it demonstrates how Chande clear identifies the changes momentum, and when that occurs the price movement follows.
Math
CMO = 100 * ((Su – Sd)/ ( Su + Sd ) )
