Elder
The Basics
Developed by Dr Alexander Elder, the Elder-ray indicator measures buying and selling pressure in the market. The Elder-ray is often used as part of the Triple Screen trading system but may also be used on its own.
Dr Elder uses a 13-day exponential moving average (EMA) to indicate the market consensus of value. Bull Power measures the ability of buyers to drive prices above the consensus of value. Bear Power reflects the ability of sellers to drive prices below the average consensus of value.
Bull Power is calculated by subtracting the 13-day EMA from the day’s High. Bear power subtracts the 13-day EMA from the day’s Low.
Indicator Type
Trend Follower
Markets
All cash and futures, not options
Works Best
Trending markets
Formula
A bar chart with 13-day exponential moving average;
Elder Ray Bull Power; and
Elder Ray Bear Power.
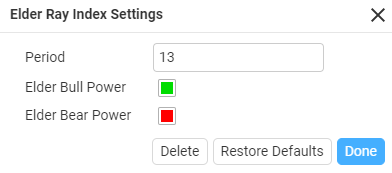
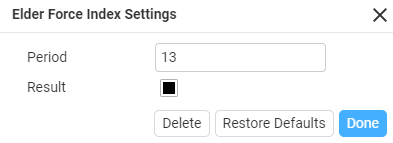
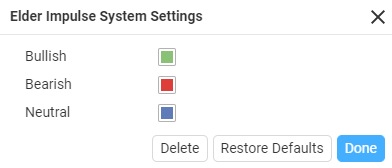
Parameters


Theory
Only trade in the direction of the trend – indicated by the slope of the 13-day EMA.
Go long if Bear Power is below zero and there is a bullish divergence.
Go short if Bull Power is above zero and there is a bearish divergence.
Interpretation

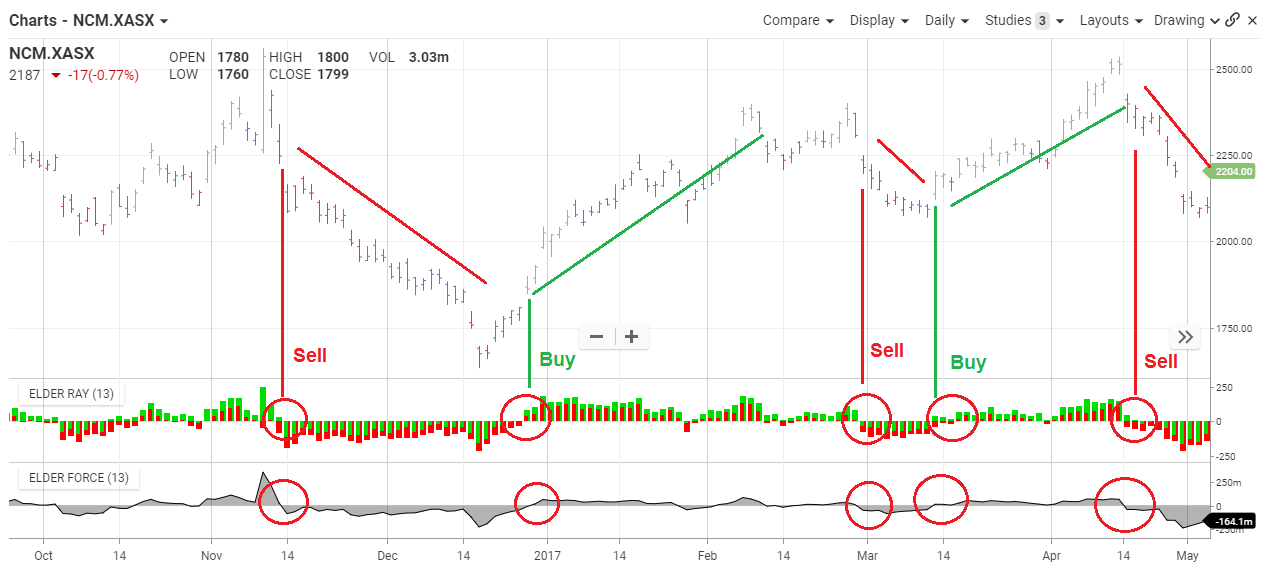
On the Newcrest chart in during 2016 and 2017 we can determine multiple buy and sell signals. We the elder tools they help use determine the beginning of trends some trends are a lot stronger than others.
On the bars when there is multiple of either green or red it helps identify the trend, while the blue bars being more neutral. The Elder force gives a better visual representation of the divergence above and below the 0 signal line.
Divergences between bull or bear power and prices indicate the best trading opportunities. The Elder-ray is an extremely accurate and effective means of identifying these opportunities
Maths
Elder Ray calculation are very simple. It consists of two lines: Bull Power and Bear Power. Bull Power is calculated as difference between bar’s High and Exponential Moving Average (EMA) applied to closing prices. Controversially, Bear Power is calculated as difference between bar’s Low and the same EMA:
Bull Power = High – EMA(Close)
Bear Power = Low – EMA(Close)
