Fibonacci Retracements
The Basics
Fibonacci Retracements
Indicator Type
Trend line tool
Markets
All cash and futures, not options
Works Best
All markets and time frames.
Formula
The vertical distance between the start and end of a move (trend) is measured. Retracement levels are then drawn back from the end of the trend at percentages derived from the Fibonacci number sequence.
Parameters
The most common levels are 31.8%, 50% and 68.2% although some traders also look at 78.6% (square root of .618).
Theory
The Fibonacci sequence of numbers starts with 1 and any number in the sequence is the sum of the preceding two numbers (1, 1, 2, 3, 5, 8, 13, 21, 34, 55, 89, 144, …). The ratio of any two consecutive numbers starts out by oscillating around .618 and approaches it almost exactly as the sequence continues. These ratios are 0, 100, 50, 67, 62.5, etc. and they describe important retracement targets in any market. The .618 value is often called the “golden ratio” and describes many natural mathematical phenomena.
Interpretation
Fibonacci retracement levels are simple yet effective tools. They provide good retracement targets as well as support and resistance levels. They are also useful in Elliott Wave and Gann analyses. Elliott wave counts tend to end at Fibonacci levels. Gann angles are drawn with slopes that equal Fibonacci ratios.
While Fibonacci levels are good initial targets they should be used in conjunction with “regular” support and resistance levels. The more bits of evidence pointing to a price level as being significant, the better.
Often, a move through the 78.6% level is the point of no return and the market attempts to retrace the entire (100%) move.

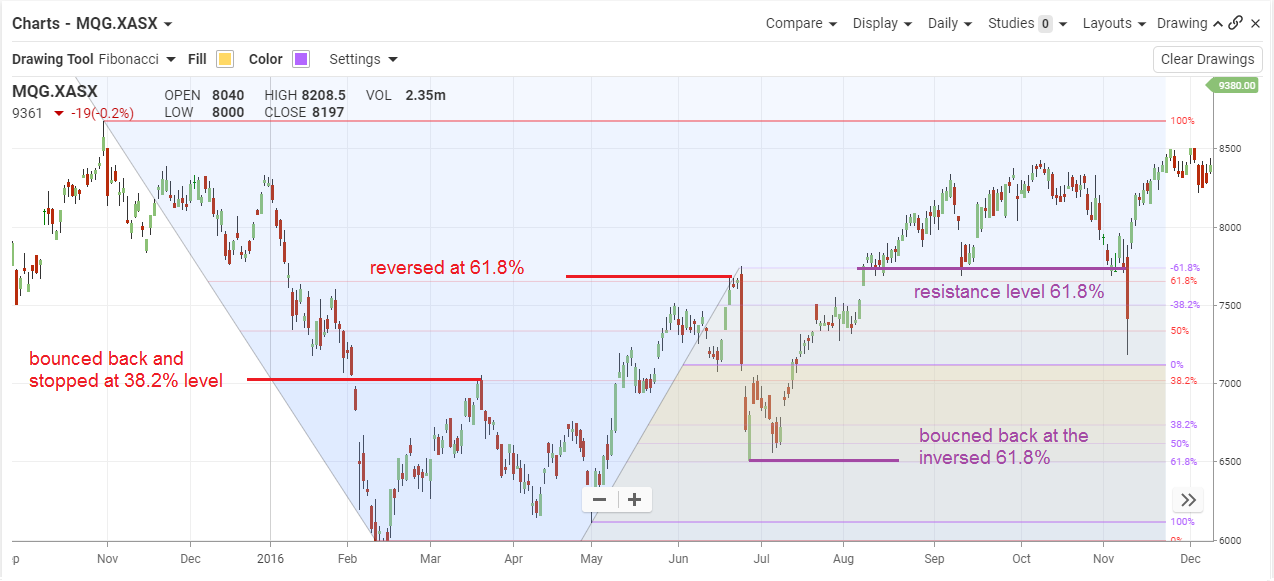
This chart shows daily data for Macquarie Group. The initial bounce in mid-March 2016 stalled at the 38.2% retracement level. When price finally punched through it moved up to 50% and headed all the way back down.
In mid-February, the MQG rallied again and then pulled back but 38.2% later in the mid-March.
Fibonacci levels are found everywhere but not all make good trading points. However, they are a good place to start. Just be careful not to look only at levels that meet an existing view of the market. And start them from different turning points. When two or move overlap the signal is better.
Math
The Fibonacci sequence starts at 0 and 1. Add them together to get 1. Continue to add the last two numbers to get the next number.
1, 1, 2, 3, 5, 8, 13, 21, 34, 55, 89, 144, 233…….
Note that the ratio of any two numbers in the sequence quickly approaches .618, a.k.a. the golden ratio.
The 38.2% ratio is derived from 1 -.618 = .382
More Fibonacci relationships:
1 / .618 = 1.618 and is often used as a projection for the next price level (161.8%)
1 / .382 = 2.618 and is also used for projections
