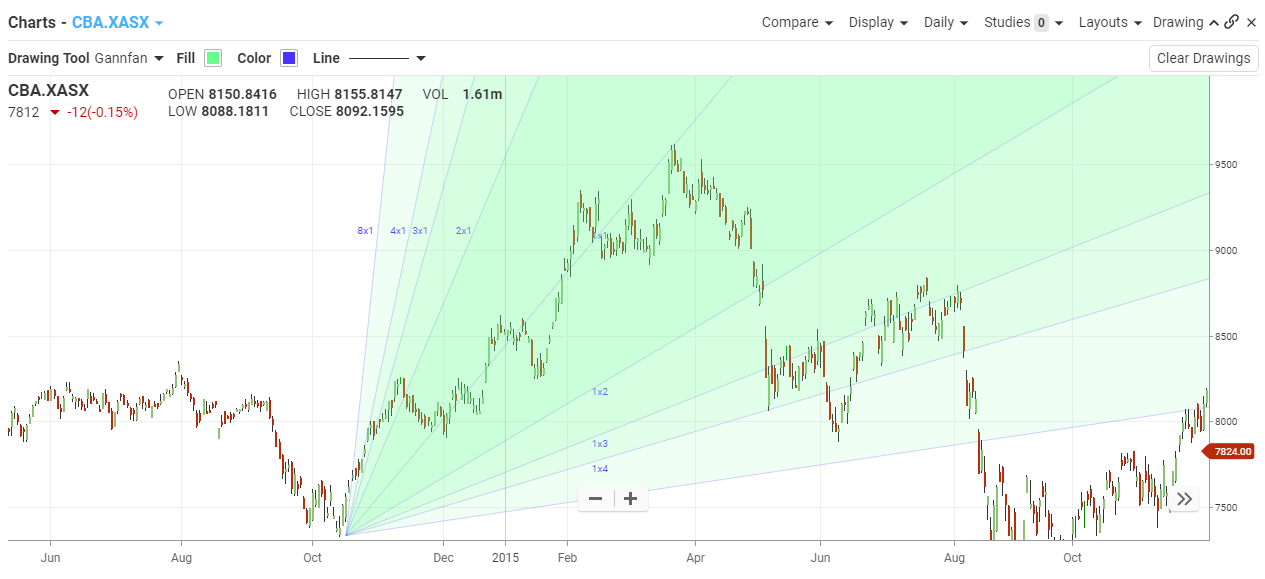
Gann
The Basics
Gann Fans were developed by W. D. Gann, who was also known for his accurate financial predictions, called the Gann studies, in the early 1900s. Gann’s ideal angle was a 45-degree angle based on his ideal balance of time and price. However, because the construction of a Gann fan relies heavily on subjective choices made by individual traders, the chart may be limited in its usefulness and accuracy. The three premises Gann based his theory on were: i) price, time and range are the only factors, ii) cyclical markets, and iii) geometric market design.
Indicator Type
Resistance Levels
Markets
All cash and futures, not options
Works Best
All markets and time frames although this study can excel in determining if a visually flat market is starting to develop a trend.
Formula
Using a Gann angle to forecast support and resistance is probably the most popular way they are used. Once the analyst determines the period he or she is going to trade (monthly, weekly, daily) and properly scales the chart, the trader simply draws the three main Gann angles: the 1X2, 1X1 and 2X1 from main tops and bottoms. This technique frames the market, allowing the analyst to read the movement of the market inside this framework.
Uptrending angles provide the support and down trending angles provide the resistance. Because the analyst knows where the angle is on the chart, he or she can determine whether to buy on support or sell at the resistance.
Traders should also note how the market rotates from angle to angle. This is known as the “rule of all angles”. This rule states that when the market breaks one angle, it will move toward the next one.
Another way to determine the support and resistance is to combine angles and horizontal lines. For example, often a down trending Gann angle will cross a 50% retracement level. This combination will then set up a key resistance point. The same can be said for up trending angles crossing a 50% level. This area becomes a key support point. If you have a long-term chart, you will sometimes see many angles clustering at or near the same price. These are called price clusters. The more angles clustering in a zone, the more important the support or resistance.
Parameters
none
Theory
The primary Gann angles are the 1X2, the 1X1 and the 2X1. The 1X2 means the angle is moving one unit of price for every two units of time. The 1X1 is moving one unit of price with one unit of time. Finally, the 2X1 moves two units of price with one unit of time. Using the same formula, angles can also be 1X8, 1X4, 4X1 and 8X1.
Interpretation

This is the best Gann fan strategy because unlike the traditional support and resistance lines the Gann angles can pinpoint significant changes in the market swing trends. We at Trading Strategy Guides have a clear understanding of what is really going on at these critical levels because we always make sure we back testing our strategies, so they have a positive expectancy.
