Negative Volume Index
The Basics
The Negative Volume Index (NVI) is a cumulative indicator that uses the change in volume to decide when the smart money is active. Paul Dysart first developed this indicator in the 1930s. In fact, the Market Technicians Association selected Dysart for their annual award in 1990 to recognize his contributions to technical analysis. Dysart’s Negative Volume Index works under the assumption that the smart money is active on days when volume decreases, and the not-so-smart money is active on days when volume increases.
Indicator Type
Trend Follower
Markets
All cash and futures, not options
Works Best
Trending markets
Formula
There are two versions of the Negative Volume Index. In the original version, Dysart formed a cumulative line by adding Net Advances when volume decreased from one period to the other. Net Advances equal advancing issues less declining issues. The cumulative NVI line was unchanged when volume increased from one period to the other. In other words, nothing was done. Norman Fosback, of Stock Market Logic, adjusted the indicator by substituting the percentage price change for Net Advances.
Parameters

Theory
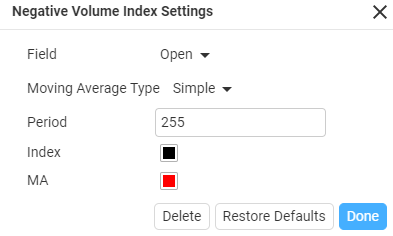
The traditional use of the Negative Volume Index is quite simple. According to Fosback, the odds favour a bull market when NVI is above its 255-day EMA and the odds favour a bear market when NVI is below. However, Fosback notes that these odds are not symmetrical. There is a 96% chance of a bull market when NVI is above its 255-day EMA, but only a 53% chance of a bear market when NVI is below its 255-day EMA.
Interpretation

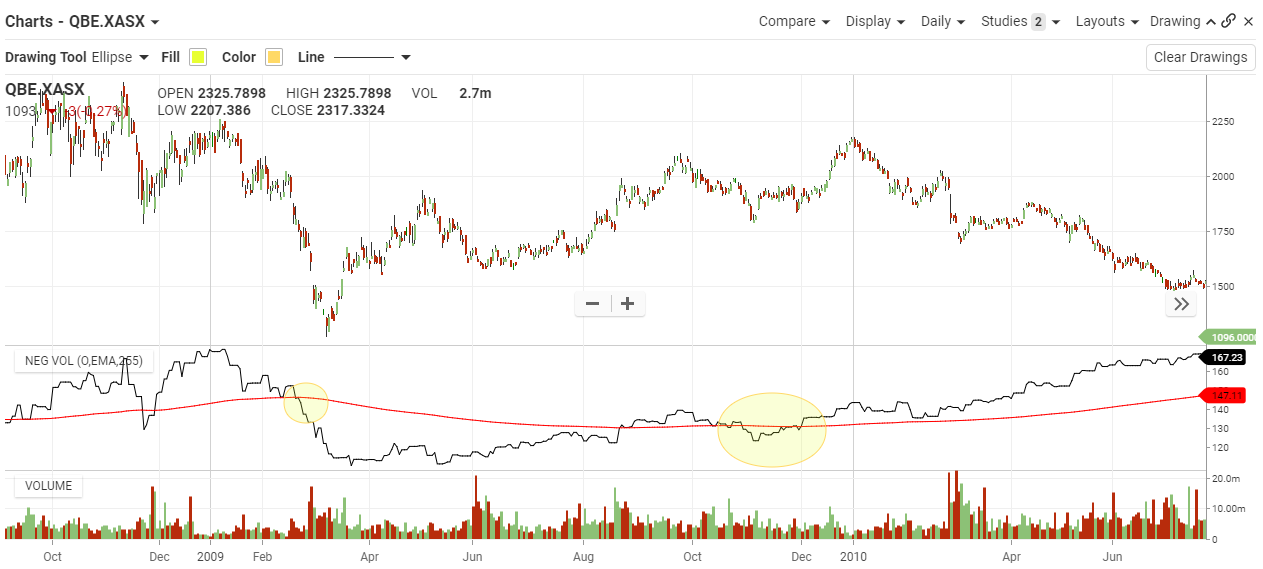
On the QBE chart in March 2009 negative volume index dropped below 255 EMA, this signalled a gradual reversal from oversold. It wasn’t until November 2010 after the price recovered that the negative volume rose above the 255 EMA and trended into an oversold cycle.
Maths
- Cumulative NVI starts at 1000
- Add the Percentage Price Change to Cumulative NVI when Volume Decreases
- Cumulative NVI is Unchanged when Volume Increases
- Apply a 255-day EMA for Signals
