PringSpecialK
The Basics
Developed by Martin Pring, Know Sure Thing (KST) is a momentum oscillator based on the smoothed rate-of-change for four different timeframes. Pring referred to this indicator as the “Summed Rate of Change (KST)” in a 1992 article in Stocks & Commodities magazine. In short, KST measures price momentum for four different price cycles. It can be used just like any momentum oscillator. Chartists can look for divergences, overbought/oversold readings, signal line crossovers and centreline crossovers. Pring frequently applied trend lines to KST. Although trend line signals do not occur often, Pring notes that such breaks reinforce signal line crossovers.
Indicator Type
Oscillator
Markets
All cash and futures, not options
Works Best
Trending markets
Formula
The Know Sure Thing looks complicated, it is a rather straightforward indicator. It is simply a weighted average of four different rate-of-change values that have been smoothed.
Parameters

Theory
KST fluctuates above/below the zero line. At its most basic, momentum favours the bulls when KST is positive and the bears when KST is negative. A positive reading means the weighted and smoothed rate-of-change values are mostly positive and prices are moving higher. A negative reading indicates that prices are moving lower.
After basic centreline crossovers, chartists can look for signal line crossovers and gauge general direction. KST is generally rising when above its signal line and falling when below its signal line. A rising and negative KST line indicates that downside momentum is waning. Conversely, a falling and positive KST line indicates that upside momentum is waning.
Even though there are many different signals possible with KST, the basic centreline and signal line crossovers are usually the most robust. Unlike RSI and the Stochastic Oscillator, KST does not have upper or lower limits. This makes it relatively ill-suited for overbought and oversold signals.
Interpretation

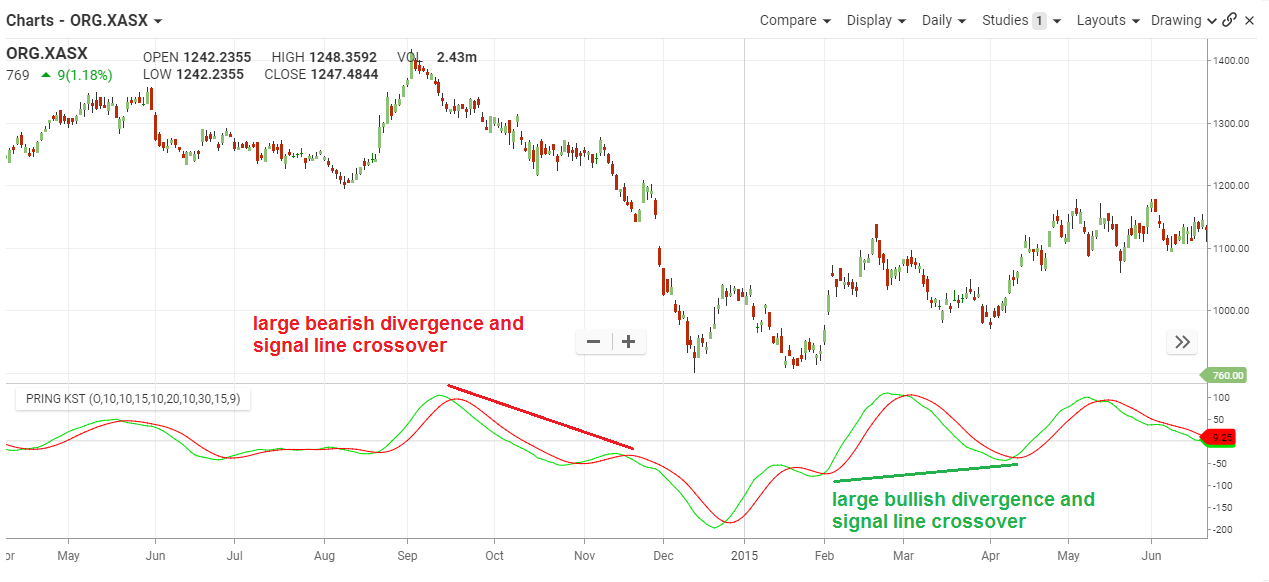
On the Origin chart in September 2014 the price peaked and shortly after KST signal crossed over the KST, signalling a strong bearish trend. Then by early October it had dropped under the 0-signal line and the trend continued for the rest of 2015.
There was a false start for a bullish divergence, but it wasn’t until mid-February 2015 it crossed the 0 signal for a continued-up trend.
Maths
The formula box below shows the four different combinations with their default settings. These combinations are then weighted and summed. The shortest timeframe carries the least weight (1) and the longest timeframe carries the most weight (4). A 9-period simple moving average is added as a signal line.
RCMA1 = 10-Period SMA of 10-Period Rate-of-Change
RCMA2 = 10-Period SMA of 15-Period Rate-of-Change
RCMA3 = 10-Period SMA of 20-Period Rate-of-Change
RCMA4 = 15-Period SMA of 30-Period Rate-of-Change
KST = (RCMA1 x 1) + (RCMA2 x 2) + (RCMA3 x 3) + (RCMA4 x 4)
Signal Line = 9-period SMA of KST
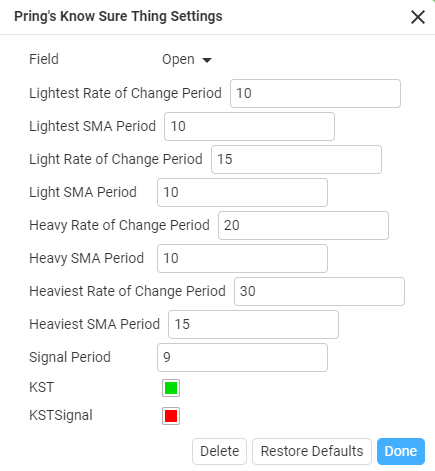
The default parameters are as follows: KST(10,15,20,30,10,10,10,15,9). The first four numbers represent the rate-of-change settings, the second four represent the moving averages for these rate-of-change indicators and the last number is the signal line moving average.
