Volume Profile
The Basics
Volume Profile is a chart overlay designed to show how much volume traded at each price level over the span of the chart. It is used to identify possible support and resistance in the future.
Indicator Type
Activity indicator
Markets
All markets that report volume data.
Works Best
All markets and time frames
Formula
Volume data is reported as is.
Parameters

There are no parameters to select.
You can select colour for the volume profile plot a by selecting the bars colour box to bring up the colour palette.
Theory
Volume Profile, sometimes called “volume by price,” shows the amount of volume occurring at each price for a particular price range. It only considers what is showing on the screen and will change if the chart is stretched or squeezed or scrolled back or forward in time. The Volume-by-Price bars are horizontal and shown on the right side of the chart to correspond with each price. By combining volume and price, the user can identify high-volume price ranges to indicate likely support or resistance in the future.
Interpretation
The more times support, or resistance area is touched by price, the stronger it becomes. However, the same is true for volume at that price level. By combining price and volume the user can quickly identify strong support and resistance zones on the chart where demand or supply are likely to swell in the future.
The larger the profile bar, the stronger the level. And the stronger the level the more important a move through that level will be.

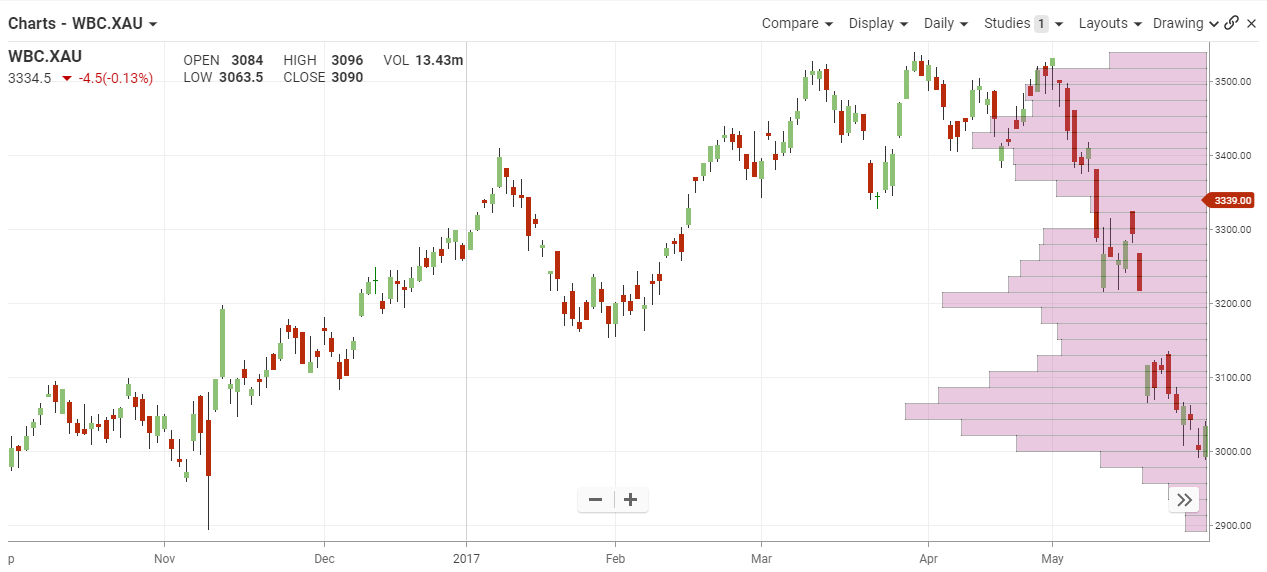
The chart of Westpac shows three heavy areas of volume at high, medium and low prices. Clearly, the lowest price zone was the strongest so if prices do start to rise there will likely be strong demand at that price level.
The lower price zone has a stronger set of volume bars and is therefore a stronger zone of support than the upper zone might be for resistance. This can be true even though the price bars show similarly sized congestion zones.
Math
None
