VWAP (Volume Weighted Average Price)
The Basics
Volume Profile is a chart overlay designed to show how much volume traded at each price level over the span of the chart. It is used to identify possible support and resistance in the future.
Indicator Type
Activity indicator
Markets
All markets that report volume data.
Works Best
All markets and time frames
Formula
Volume data is reported as is.
Parameters
About VWAP
The VWAP indicator (Volume Weighted Average Price) will operate on any bar interval available in intraday data. It will calculate and plot the VWAP line (using a Time Weighted Average Price algorithm) as well as up to three user-defined Standard Deviation bands. When used with an intraday chart, the VWAPcalculation is cumulative throughout the day and will automatically reset on each new day. When used with Daily, Weekly, or Monthly charts, the VWAP and Standard Deviation plots will be based on a rolling lookback period that you define (default is 20 bars).
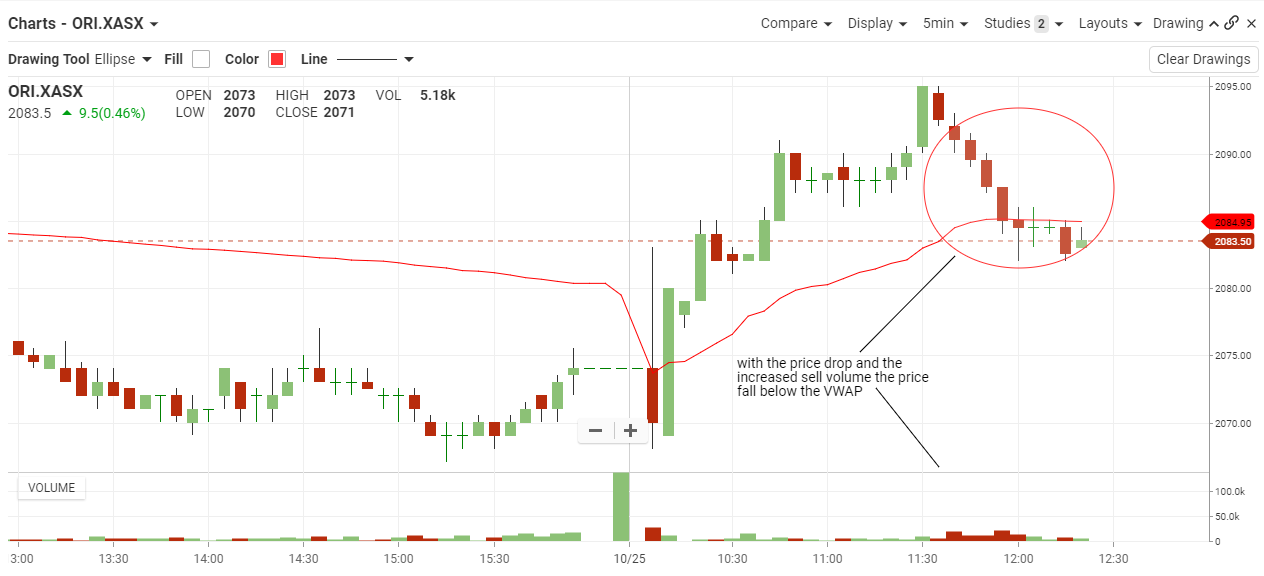
VWAP and 3 Standard Deviation bands displayed on a 5-min ORI chart. The VWAP calculation is cumulative and will reset on each new day.
Interpretation
When the price and volume is rising the VWAP will increase and create a higher VWAP for the day. The VWAP can help determine a trend for the day, for either a rising or falling. Alternately when there is a sharp price movement and increase in the volume, it can cross the current price.
If we look at the ORI chart, you will see the VWAP trailer the price trend of the day, until it reversed and the VWAP crossed the price bars.

